Over the years, I’ve noticed that some Calgary communities seem to remain consistently desirable through changing market conditions while others experience sharper swings in pricing,,

Dated: September 11 2025
Views: 819
Released September 2, 2025
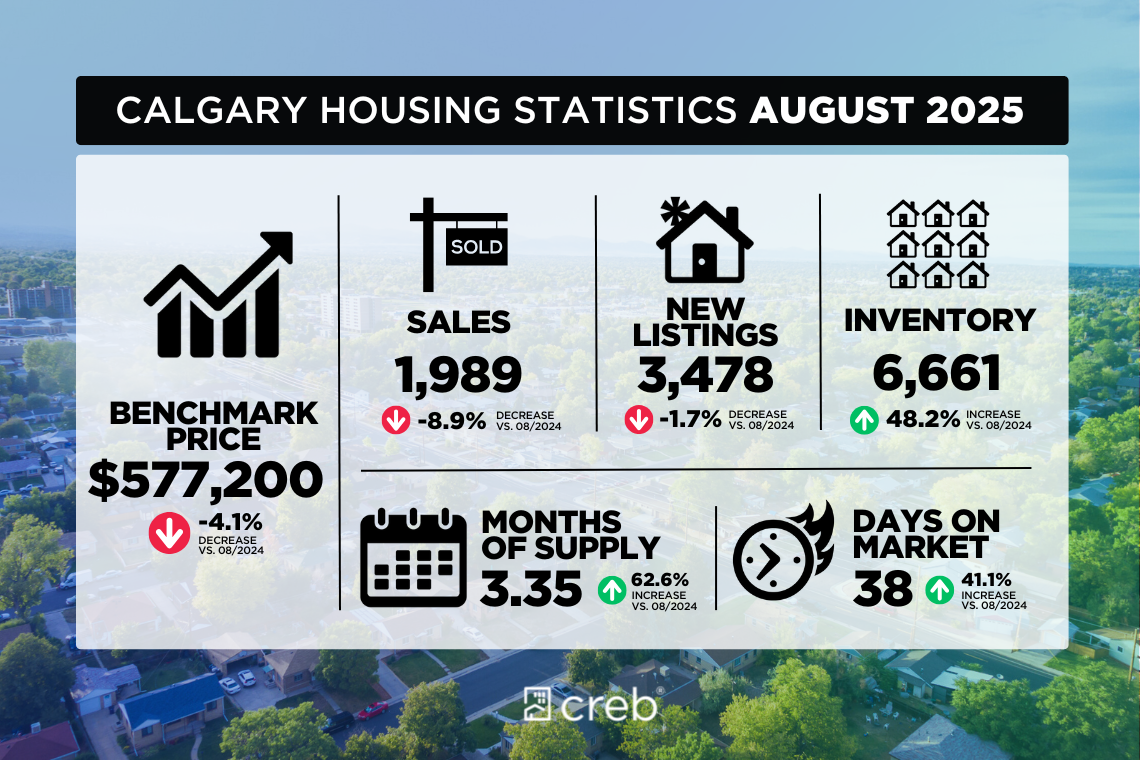
Benchmark Price: $577,200 (↓ from July, ↓ ~4% YoY).
Drivers: Declines led mainly by apartment condos and row homes. Detached and semi-detached seeing only modest pullbacks.
Sales: 1,989 in August (↓ 9% YoY), still above long-term trends but slower than the past 4 years.
Supply: Inventory at 6,661 units (highest August since 2019).
Months of Supply: 3.4 (balanced vs last year’s sellers’ market, but not a true buyers’ market).
Sales: 995 units (↓ from July).
New Listings: 1,748; inventory at 3,051 (highest August since 2020).
Benchmark Price: $755,600 (↓ ~1% MoM & YoY).
Trends by District:
North East & East: Prices ↓ ~5% YoY (buyer market conditions).
City Centre: Prices ↑ ~2% YoY.
YTD: Prices still ~2% ↑ vs 2024.
Sales: Up YoY in August; YTD still ↓ 8% vs 2024.
Inventory: More stable; months of supply < 3.
Benchmark Price: $687,200 (↓ MoM, ↑ ~1% YoY, ↑ ~4% YTD).
Trends by District:
City Centre: Strongest YoY gains.
North East, East, North: Largest declines.
Sales: Slowed; YTD ↓ ~16%.
Inventory: 1,103 units (2nd-highest August ever, near 2018 levels).
Benchmark Price: $439,600 (↓ for 4 months straight, ↓ ~5% YoY).
Trends by District:
Declines >5% in North East, North, South, East.
Pressure from both resale supply and competition from new builds.
Sales: 449 (↓ sharply; YTD ↓ ~30%).
New Listings: 877; inventory at 1,979 (highest August ever).
Months of Supply: ~4 (unchanged since June).
Benchmark Price: $326,500 (↓ for 5 months straight, ↓ ~6% YoY).
Trends by District:
City Centre: ↓ ~5% YoY.
West: ↓ ~3% YoY.
North East: Sharpest declines at ↓ ~11% YoY.
Shift to Balance: After years of tight supply, inventory growth is now tempering prices.
Density Under Pressure: Row and apartment units facing the steepest corrections due to excess supply.
Detached Stability: Still showing resilience overall, with only modest declines and some district-level gains.
Variation Matters: Market outcomes highly dependent on product type and district (e.g., City Centre stronger, NE/East weaker).

I’m Byron Henry, a Calgary real estate agent with a background in software development, data analysis, and residential real estate investing. That combination shapes how I approach property deci....
Over the years, I’ve noticed that some Calgary communities seem to remain consistently desirable through changing market conditions while others experience sharper swings in pricing,,
If you’re looking at condos in Calgary, it’s easy to focus on price, layout, or location.What often gets overlooked is how that unit will perform when it comes time to sell.In apartment
There’s a long-standing belief that Calgary home prices follow oil.To test that idea, I analyzed 10 years of data comparing WCS oil prices with Calgary’s total residential benchmark.
At a headline level, Calgary’s housing market in March looks relatively balanced. Sales, inventory, and prices all moved in expected seasonal directions as the spring market began. But when
Should you require assistance in navigating our website or searching for real estate, please contact our offices at 833-497-4422.


 Data is supplied by Pillar 9™ MLS® System. Pillar 9™ is the owner of the copyright in its MLS® System. Data is deemed reliable but is not guaranteed accurate by Pillar 9™. The trademarks MLS®, Multiple Listing Service® and the associated logos are owned by The Canadian Real Estate Association (CREA) and identify the quality of services provided by real estate professionals who are members of CREA. Used under license.

The listing data displayed is deemed reliable but is not guaranteed accurate by CREA®. Data last updated on September 11, 2026 10:16 PM UTC The trademarks REALTOR®, REALTORS®; and the REALTOR® logo are controlled by The Canadian Real Estate Association (CREA®) and identify real estate professionals who are members of CREA®. Used under license. The trademarks MLS®, Multiple Listing Service® and the associated logos are owned by The Canadian Real Estate Association (CREA®) and identify the quality of services provided by real estate professionals who are members of CREA®. Used under license.
Show More...